ENGlobal Corp. (ENG) Stock Analysis
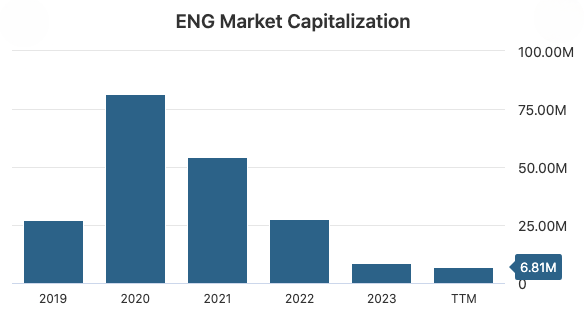
Market Capitalization: $6.81 Million
Shares Outstanding: 5.16 Million
Sector: Energy
Industry: Oil & Gas Equipment & Services
Analysis as of: October 2024

1. Company Overview
ENGlobal Corporation (NASDAQ: ENG) is a U.S.-based engineering and professional services company founded in 1985 and headquartered in Houston, Texas. The company provides engineering and project management services primarily to the energy sector, both domestically and internationally.
Business Segments:
- Commercial Segment:
- Offers multi-disciplined engineering services and fabrication for projects requiring professional engineering and project management services.
- Services include conceptual studies, project definition, cost estimating, engineering design, environmental compliance, material procurement, project management, construction management, and fabrication.
- Government Services Segment:
- Provides design, integration, and implementation of process distributed control and analyzer systems, advanced automated data gathering systems, information technology, and maintenance of these systems.
- Offers services related to the engineering, design, installation, and maintenance of automated fuel handling and tank gauging systems for the U.S. military.
Client Base:
- Serves Fortune 500 companies in the energy industry.
- Provides services to the U.S. government.
2. Financial Performance
a. Revenue and Growth
- Trailing Twelve Months (TTM) Revenue (as of June 29, 2024): $28.77 Million
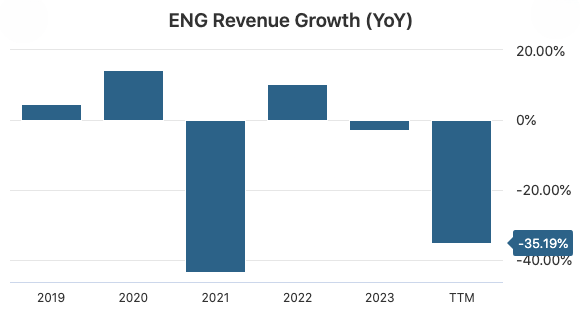
- Year-over-Year (YoY) Revenue Growth (TTM): -35.19%
Revenue Trend:
Fiscal Year | Revenue (in Millions USD) | YoY Growth |
FY 2019 | $56.45 | +4.54% |
FY 2020 | $64.45 | +14.18% |
FY 2021 | $36.41 | -43.51% |
FY 2022 | $40.19 | +10.38% |
FY 2023 | $39.04 | -2.87% |
TTM 2024 | $28.77 | -35.19% |

Analysis:
ENGlobal’s revenue has been declining significantly, with a 35.19% decrease in the TTM ending June 29, 2024. The company experienced a substantial drop in revenue in FY 2021, and despite a slight recovery in FY 2022, the downward trend has continued. Factors contributing to this decline may include reduced demand in the energy sector, project delays, or loss of key clients.
b. Profitability
- Net Income (TTM): – $7.09 Million
- Earnings Per Share (EPS, TTM): – $1.38
- Profit Margin: -24.63%
- Return on Assets (ROA): -16.78%
- Return on Equity (ROE): Not applicable due to negative equity
Analysis:
The company has been unprofitable over the past several years, with net losses increasing. The negative profit margin indicates that the company is not covering its costs. The negative ROA shows inefficiency in utilizing assets to generate profits. Negative equity makes ROE not meaningful.
c. Gross Margin and Operating Margin
- Gross Margin (TTM): 10.61%
- Operating Margin (TTM): -18.20%
Analysis:
The gross margin of 10.61% suggests low profitability from core operations. The negative operating margin indicates that operating expenses exceed gross profit, leading to operating losses. This raises concerns about the company’s cost structure and ability to generate sustainable profits.
d. Cash Flow
- Operating Cash Flow (TTM): – $815,000
- Capital Expenditures (CapEx, TTM): – $20,000
- Free Cash Flow (FCF, TTM): – $835,000
- Free Cash Flow Margin: -2.90%
- Free Cash Flow Per Share: – $0.16
Analysis:
Negative operating cash flow indicates that the company’s core operations are not generating sufficient cash to cover expenses. Negative free cash flow suggests reliance on external financing to fund operations. The cash burn may pose liquidity risks if it continues.
3. Balance Sheet
- Total Assets (as of June 29, 2024): $14.82 Million
- Total Liabilities: $18.76 Million
- Shareholders’ Equity: – $3.95 Million (Negative Equity)
- Total Debt: $9.72 Million
- Cash & Equivalents: $227,000
- Net Debt Position: – $9.49 Million
- Net Cash Per Share: – $1.84
- Debt-to-Equity Ratio: Not meaningful due to negative equity
- Current Ratio: 0.80
- Quick Ratio: 0.76
- Working Capital: – $2.20 Million
Analysis:
- Liquidity: The current ratio of 0.80 and quick ratio of 0.76 indicate that the company may struggle to meet short-term obligations. Negative working capital reinforces liquidity concerns.
- Leverage: Negative shareholders’ equity means liabilities exceed assets, which is a red flag. High debt levels increase financial risk.
- Net Cash Position: Negative net cash position indicates that debt exceeds cash reserves significantly.
4. Valuation
- Stock Price (as of October 8, 2024): $1.32
- Market Capitalization: $6.81 Million
- Price-to-Sales (PS) Ratio: 0.24
- Price-to-Book (PB) Ratio: Not meaningful due to negative equity
- Price-to-Earnings (PE) Ratio: Not applicable (due to negative earnings)
- Price-to-Free Cash Flow (P/FCF) Ratio: Not meaningful due to negative free cash flow
Analysis:
- PS Ratio: A low PS ratio of 0.24 suggests that the market values the company at 24% of its annual revenue, which may indicate undervaluation, but could also reflect investor concerns about the company’s financial health.
- Valuation Challenges: Negative earnings and equity make traditional valuation metrics less informative. The low market capitalization reflects the company’s financial difficulties.
5. Market Performance
- 52-Week Range: $1.01 – $2.80
- 52-Week Price Change: -46.49%
- Beta: 1.46
Analysis:
The stock price has decreased by 46.49% over the past year, indicating negative investor sentiment. The beta of 1.46 suggests higher volatility compared to the overall market. The significant drop in stock price reflects concerns over the company’s financial stability and future prospects.
6. Financial Health and Risks
a. Liquidity
- Current Ratio: 0.80
- Quick Ratio: 0.76
Analysis:
Ratios below 1 indicate potential liquidity issues. The company may face challenges in meeting its short-term obligations without raising additional capital or restructuring debt.
b. Leverage
- Total Debt: $9.72 Million
- Debt-to-Equity Ratio: Not meaningful due to negative equity
- Interest Coverage Ratio: -27.28
Analysis:
Negative equity and a negative interest coverage ratio are significant red flags. The company is not generating enough earnings to cover its interest expenses, increasing the risk of default.
c. Profitability Concerns
- Persistent Losses: Continuous net losses over the past several years.
- Negative Margins: Both operating and net profit margins are negative.
- Asset Writedowns: The company recorded asset writedowns of $1.8 million in the TTM.
d. Operational Risks
- Revenue Decline: Significant decrease in revenue indicates potential loss of clients or market share.
- Cost Management: High operating expenses relative to revenue impact profitability.
- Order Backlog: Decrease in order backlog may affect future revenues.
e. Market Risks
- Industry Challenges: The energy sector faces volatility due to fluctuating commodity prices and shifting towards renewable energy.
- Competition: The company operates in a competitive market with larger players.
- Economic Conditions: Economic downturns can reduce capital expenditure in the energy sector, affecting demand for the company’s services.
7. Conclusion
Pros:
- Established Presence: Over 35 years in the industry with experience in engineering services.
- Client Base: Serves Fortune 500 companies and the U.S. government, which could provide opportunities if leveraged effectively.
Cons:
- Financial Instability: Negative equity, persistent losses, and liquidity concerns raise questions about the company’s viability.
- Revenue Decline: Significant decrease in revenue and order backlog.
- High Debt Levels: Substantial debt with insufficient earnings to cover interest payments.
- Negative Cash Flow: Operations are not generating positive cash flow, leading to potential cash shortages.
- Market Challenges: Operating in a challenging industry with competitive pressures and shifting energy trends.
Disclaimer:
This analysis is for informational purposes only and does not constitute investment advice or a recommendation to buy or sell any securities. Investing in stocks involves risks, including the potential loss of principal. Past performance is not indicative of future results. Investors should conduct their own research or consult a qualified financial advisor before making investment decisions.
