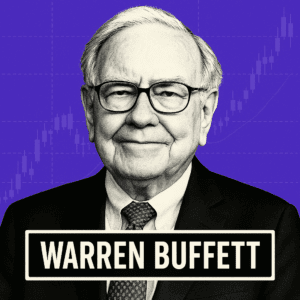
Warren Buffett - Berkshire Hathaway Portfolio
Warren Buffett - Berkshire Hathaway Q3 2024 Portfolio
Berkshire Hathaway, a hedge fund managed by Warren Buffett, disclosed 40 security holdings in their SEC 13F filing for the third quarter of 2024, with a total portfolio value $266,378,903,000
As of Q3 2024, Warren Buffett’s Berkshire Hathaway portfolio highlights strategic shifts across various key holdings. Below is a detailed overview of the top 10 positions:
AAPL – Apple Inc.
Portfolio Allocation: 26.24%
Recent Activity: Reduced 25.00%
Shares Held: 300,000,000
Reported Price: $233.00 per share
Value at Reported Price: $69,900,000,000
Apple remains the largest holding in Buffett’s portfolio, despite a substantial reduction in shares. This reduction may indicate profit-taking or a desire to rebalance the portfolio. Apple continues to be a dominant force in consumer electronics and services, with its vast ecosystem of products and loyal customer base.
AXP – American Express
Portfolio Allocation: 15.44%
Recent Activity: No change reported
Shares Held: 151,610,700
Reported Price: $271.20 per share
Value at Reported Price: $41,116,821,000
American Express maintains a stable position, reflecting Buffett’s long-standing confidence in the financial services company. Known for its premium brand and customer loyalty, American Express is well-positioned to benefit from consumer spending, especially among affluent customers.
BAC – Bank of America Corp.
Portfolio Allocation: 11.88%
Recent Activity: Reduced 22.77%
Shares Held: 797,683,307
Reported Price: $39.68 per share
Value at Reported Price: $31,652,074,000
Bank of America remains a core financial holding, although reduced significantly in Q3. This cutback might reflect strategic rebalancing amid market conditions or interest rate concerns. As a leading bank in the U.S., Bank of America is a strong performer in retail and commercial banking.
KO – Coca-Cola Co.
Portfolio Allocation: 10.79%
Recent Activity: No change reported
Shares Held: 400,000,000
Reported Price: $71.86 per share
Value at Reported Price: $28,744,001,000
Coca-Cola’s unchanged position underlines Buffett’s confidence in this iconic brand. Coca-Cola, with its global footprint and diverse beverage portfolio, is a reliable player in the consumer staples sector and offers stability and steady dividends.
CVX – Chevron Corp.
Portfolio Allocation: 6.56%
Recent Activity: No change reported
Shares Held: 118,610,534
Reported Price: $147.27 per share
Value at Reported Price: $17,467,773,000
Chevron’s stable position reflects a long-term bet on the energy sector. As one of the world’s largest oil companies, Chevron provides diversification for the portfolio and potential for high returns as energy demand persists globally.
OXY – Occidental Petroleum
Portfolio Allocation: 4.94%
Recent Activity: No change reported
Shares Held: 255,281,524
Reported Price: $51.54 per share
Value at Reported Price: $13,157,210,000
Occidental Petroleum remains an important energy holding, illustrating Buffett’s increased focus on the sector. Occidental’s strength in oil and gas production provides exposure to potential gains as energy prices fluctuate.
MCO – Moody’s Corp.
Portfolio Allocation: 4.4%
Recent Activity: No change reported
Shares Held: 24,669,778
Reported Price: $474.59 per share
Value at Reported Price: $11,708,030,000
Moody’s continues to be a strategic holding, benefiting from its dominant position in credit ratings and financial analytics. Its stable cash flows and growth potential make it a valuable asset in the portfolio, especially as demand for credit assessments remains strong.
KHC – Kraft Heinz Co.
Portfolio Allocation: 4.29%
Recent Activity: No change reported
Shares Held: 325,634,818
Reported Price: $35.11 per share
Value at Reported Price: $11,433,038,000
Kraft Heinz remains a key holding in the consumer staples sector. Known for its well-established food brands, Kraft Heinz is focused on streamlining operations and adapting to changing consumer tastes, which aligns with Buffett’s value-investing philosophy.
CB – Chubb Limited
Portfolio Allocation: 2.93%
Recent Activity: No change reported
Shares Held: 27,033,784
Reported Price: $288.39 per share
Value at Reported Price: $7,796,273,000
Chubb, a leader in insurance, provides diversification and stability within the portfolio. The company’s robust risk management and financial performance make it an attractive holding, especially amid potential market uncertainties.
DVA – DaVita HealthCare Partners
Portfolio Allocation: 2.22%
Recent Activity: No change reported
Shares Held: 36,095,570
Reported Price: $163.93 per share
Value at Reported Price: $5,917,147,000
DaVita, a healthcare provider specializing in kidney dialysis, remains in the portfolio, reflecting Buffett’s interest in the healthcare sector. With a steady demand for dialysis services, DaVita serves as a defensive holding that provides resilience against economic fluctuations.
Analysis of Buffett’s Q3 2024 Portfolio Strategy
1. Focus on Core Holdings
Apple continues to lead the portfolio, albeit with a reduced allocation. This reduction may signal profit-taking, as Apple has grown significantly in recent years. Core holdings like American Express, Coca-Cola, and Bank of America remain relatively stable, underscoring Buffett’s preference for financially strong companies with established brands.
2. Energy Sector Bet
The continued investment in Chevron and Occidental Petroleum suggests a positive outlook on energy. As the world balances energy needs with sustainable goals, these companies are positioned to benefit from sustained oil and gas demand in the near term.
3. Diversification and Stability
Buffett’s portfolio balances high-growth tech and finance stocks with stable, defensive holdings in consumer staples (Coca-Cola, Kraft Heinz) and healthcare (DaVita). This approach provides resilience against market volatility while positioning for potential growth.
4. Strategic Rebalancing
The reductions in Apple and Bank of America indicate a cautious approach toward concentrated positions, freeing up capital that could be redeployed or kept liquid for future opportunities.
Conclusion
Warren Buffett’s Q3 2024 portfolio exemplifies a blend of core, high-confidence investments and defensive holdings. His commitment to iconic brands and high-quality companies demonstrates a long-term investment strategy that balances growth with stability. The stable positions in financial and consumer sectors, combined with a modest reduction in certain high-value stocks, reflect a cautious yet optimistic view of future market opportunities.
Disclaimer:
This analysis is for informational purposes only and does not constitute investment advice or a recommendation to buy or sell any securities. Investing involves risks, including the potential loss of principal. Past performance is not indicative of future results. Investors should conduct their own research or consult a qualified financial advisor before making investment decisions.
Who is Warren Buffett ?
1930:
Warren Buffett was born in Omaha, Nebraska.
1942:
Buffett buys his first stock, Cities Service Preferred, at age 11.
1951:
Buffett graduates from Woodrow Wilson High School in Omaha.
1952:
Buffett enrolls at the University of Pennsylvania, where he studies economics and finance.
1954:
Buffett transfers to Columbia University, where he studies under Benjamin Graham, the father of value investing.
1956:
Buffett graduates from Columbia University and takes a job as a securities analyst at Graham-Newman Corp.
1957:
Buffett marries Susan Thompson.
1962:
Buffett leaves Graham-Newman Corp. to start his own investment partnership, Buffett Partnership, Ltd.
1965:
Buffett buys a controlling interest in Berkshire Hathaway, a textile company.
1967:
Buffett begins to transition Berkshire Hathaway from a textile company to an investment company.
1970:
Buffett Partnership, Ltd. is liquidated.
1972:
Buffett becomes the chairman and CEO of Berkshire Hathaway.
1973:
Berkshire Hathaway’s stock price falls by 50% during the stock market crash.
1980:
Berkshire Hathaway’s stock price begins to recover.
1985:
Buffett buys See’s Candies.
1987:
Berkshire Hathaway survives the Black Monday stock market crash relatively unscathed.
1990:
Buffett buys Geico.
1996:
Buffett buys American Express.
1999:
Buffett is named “Investor of the Century” by Time magazine.
2006:
Buffett buys The Buffalo News.
2008:
Buffett survives the financial crisis.
2011:
Buffett donates $31 billion to the Bill & Melinda Gates Foundation.
2012:
Buffett is awarded the Presidential Medal of Freedom.
2019:
Buffett becomes the third-wealthiest person in the world.
2020:
Buffett’s net worth falls by $24 billion during the COVID-19 pandemic.
2021:
Buffett’s net worth recovers and he becomes the fourth-wealthiest person in the world.
2022:
Buffett turns 92 years old.
Interesting Facts:
Buffett bought his first stock when he was just 11 years old.
He is known as the “Oracle of Omaha.”
Buffett is widely considered one of the greatest investors of all time.
He is also a noted philanthropist, having pledged to give away 99% of his wealth to charitable causes.
He is also a fan of playing bridge, and has been known to play the game for hours on end.
Buffett is a longtime friend of Microsoft co-founder Bill Gates, and the two have worked together on several philanthropic initiatives.
Is Apple Inc. (AAPL) a Buffett-Type-Investment?
Market Capitalization: $3.52 Trillion
Shares Outstanding: 15.20 Billion
Sector: Technology
Industry: Consumer Electronics
Analysis as of: October 17, 2024
1. Company Overview
Apple Inc. (NASDAQ: AAPL) is a global technology company renowned for its innovative consumer electronics, software, and online services. Founded in 1976 and headquartered in Cupertino, California, Apple has revolutionized personal technology with products like the iPhone, iPad, Mac, Apple Watch, and Apple TV.
Key Product Lines:
- iPhone: A line of smartphones that generate a significant portion of Apple’s revenue.
- Mac: Personal computers known for their performance and design.
- iPad: Multi-purpose tablets catering to both personal and professional use.
- Wearables, Home, and Accessories: Includes AirPods, Apple Watch, Beats products, and HomePod.
Services:
- App Store: Platform for discovering and downloading applications and digital content.
- Apple Music: Music streaming service offering a curated listening experience.
- Apple TV+: Streaming service with exclusive original content.
- Apple Pay: Cashless payment service.
- Other Services: Apple Arcade, Apple Fitness+, Apple News+, Apple Card, and iCloud services.
Distribution Channels:
- Direct Sales: Retail and online stores, direct sales force.
- Third-Party Channels: Cellular network carriers, wholesalers, retailers, and resellers.
2. Financial Performance
a. Revenue and Growth
- Trailing Twelve Months (TTM) Revenue (as of June 29, 2024): $385.60 Billion
- Year-over-Year (YoY) Revenue Growth (TTM): +0.43%
Revenue Trend (in Millions USD):
Fiscal Year Ending | Revenue | YoY Growth |
Sep 28, 2019 | $260,174 | -2.04% |
Sep 26, 2020 | $274,515 | +5.51% |
Sep 25, 2021 | $365,817 | +33.26% |
Sep 24, 2022 | $394,328 | +7.79% |
Sep 30, 2023 | $383,285 | -2.80% |
TTM 2024 | $385,603 | +0.43% |
Analysis:
- Slowing Growth: After significant growth in FY 2021 and FY 2022, Apple’s revenue growth has slowed considerably, with a modest increase of 0.43% in the TTM period.
- Market Saturation: The slowdown may be due to market saturation in smartphones and increased competition.
- Diversification Efforts: Growth in services and wearables segments may help offset stagnation in hardware sales.
b. Profitability
- Net Income (TTM): $101.96 Billion
- Earnings Per Share (EPS, TTM): $6.57
- Profit Margin: 26.44%
- Return on Equity (ROE): 160.58%
- Return on Assets (ROA): 22.61%
Analysis:
- Strong Profitability: High profit margins reflect efficient operations and strong pricing power.
- Exceptional ROE: The high ROE is partly due to significant share buybacks, reducing shareholder equity.
- Consistent Earnings: EPS has grown steadily, with a TTM EPS of $6.57.
c. Gross Margin and Operating Margin
- Gross Margin (TTM): 45.96%
- Operating Margin (TTM): 31.27%
- EBITDA Margin (TTM): 34.18%
Analysis:
- Robust Margins: Gross and operating margins indicate strong control over costs and efficient operations.
- Margin Stability: Margins have remained relatively stable over recent years, showcasing consistent operational performance.
d. Cash Flow
- Operating Cash Flow (TTM): $113.04 Billion
- Capital Expenditures (CapEx, TTM): – $8.70 Billion
- Free Cash Flow (FCF, TTM): $104.34 Billion
- Free Cash Flow Margin: 27.06%
- Free Cash Flow Per Share: $6.86
Analysis:
- Strong Cash Generation: Apple generates substantial free cash flow, providing flexibility for investments, acquisitions, and shareholder returns.
- CapEx Efficiency: Relatively low CapEx compared to cash flow indicates a capital-efficient business model.
- Shareholder Returns: High free cash flow supports dividends and aggressive share repurchase programs.
3. Balance Sheet
- Total Assets (as of June 29, 2024): $331.61 Billion
- Total Liabilities: $264.90 Billion
- Shareholders’ Equity: $66.71 Billion
- Total Debt: $101.30 Billion
- Cash & Equivalents: $61.80 Billion
- Net Cash Position: $51.74 Billion
- Net Cash Per Share: $3.40
- Debt-to-Equity Ratio: 1.52
- Current Ratio: 0.95
- Quick Ratio: 0.80
- Working Capital: – $6.19 Billion
Analysis:
- Liquidity: The current ratio of 0.95 suggests current liabilities slightly exceed current assets, but Apple’s strong cash flow mitigates immediate liquidity concerns.
- Leverage: A debt-to-equity ratio of 1.52 indicates moderate leverage. However, Apple’s substantial cash reserves and consistent earnings reduce financial risk.
- Shareholder Equity Decline: Decreasing equity due to share buybacks and dividends exceeding net income.
4. Valuation
- Current Stock Price (as of October 16, 2024): $231.78
- Price-to-Earnings (PE) Ratio (TTM): 35.30
- Forward PE Ratio: 32.16
- Price-to-Book (PB) Ratio: 52.89
- Price-to-Sales (PS) Ratio: 9.29
- Price-to-Free Cash Flow (P/FCF) Ratio: 33.77
- Enterprise Value (EV): $3.47 Trillion
- EV/EBITDA Ratio: 26.35
- EV/EBIT Ratio: 28.79
- PEG Ratio: 3.41
Analysis:
- High Valuation Multiples: Elevated PE and PB ratios suggest the stock is trading at a premium, potentially reflecting strong investor confidence.
- Growth Expectations: A PEG ratio of 3.41 indicates the stock may be overvalued relative to its earnings growth rate.
- Market Premium: Investors may be willing to pay a premium for Apple’s brand strength and consistent performance.
5. Market Performance
- 52-Week Range: $164.08 – $237.49
- 52-Week Price Change: +29.60%
- Beta: 1.24
Analysis:
- Strong Appreciation: The stock has appreciated nearly 30% over the past year, outperforming broader market indices.
- Volatility: A beta of 1.24 suggests higher volatility than the overall market.
- Investor Sentiment: Positive sentiment likely driven by consistent earnings and product launches.
6. Financial Health and Risks
a. Liquidity
- Current Ratio: 0.95
- Quick Ratio: 0.80
Analysis:
- Adequate Liquidity: Despite a current ratio below 1, Apple’s strong cash flows alleviate liquidity concerns.
- Negative Working Capital: Common in technology companies due to efficient cash management practices.
b. Leverage
- Total Debt: $101.30 Billion
- Debt-to-Equity Ratio: 1.52
- Interest Coverage Ratio: 30.66
Analysis:
- Manageable Debt Levels: High interest coverage ratio indicates ample earnings to cover debt obligations.
- Capital Structure: Use of debt to finance share buybacks and dividends enhances shareholder returns.
c. Profitability and Cash Flow
- Consistent Profitability: High margins and returns on equity and assets showcase operational excellence.
- Cash Flow Generation: Strong operating and free cash flows support ongoing investments and shareholder distributions.
d. Operational Risks
- Product Dependence: Significant revenue from the iPhone makes Apple vulnerable to market shifts in smartphones.
- Innovation Requirement: Ongoing need to innovate to maintain competitive edge and market share.
- Supply Chain Risks: Potential disruptions could impact product availability and costs.
e. Market Risks
- Competition: Intense competition in consumer electronics and services could pressure margins.
- Regulatory Scrutiny: Antitrust and privacy concerns may lead to increased regulation.
- Economic Factors: Global economic downturns could reduce consumer spending on discretionary products.
7. Conclusion
Pros:
- Strong Brand and Ecosystem: Loyal customer base and integrated ecosystem enhance competitive advantage.
- Diversified Revenue Streams: Growth in services and wearables reduces reliance on hardware sales.
- Robust Financials: High profitability, strong cash flows, and substantial cash reserves.
- Shareholder-Friendly Policies: Regular dividends and share repurchase programs.
Cons:
- High Valuation: Elevated multiples may limit upside potential and increase downside risk.
- Market Saturation: Slowing growth in key product segments due to market saturation.
- Regulatory Risks: Potential for increased regulation and antitrust actions.
- Innovation Challenges: Pressure to continuously innovate and meet consumer expectations.
Disclaimer:
This analysis is for informational purposes only and does not constitute investment advice or a recommendation to buy or sell any securities. Investing in stocks involves risks, including the potential loss of principal. Past performance is not indicative of future results. Investors should conduct their own research or consult a qualified financial advisor before making investment decisions.